
Fresh from a double victory at the Stack Magazine Awards, editor James Cartwright from Weapons Of Reason reveals all about the mag's approach to information design.
Who is in the team working on the infographics for WOR?
We’ve got a fantastic in-house team of designers and illustrators, who have worked on graphic data for Google, Facebook and the World Economic Forum – so they know what’s what when it comes to visualising stats.
What’s the process of constructing an infographic, from gathering data, to finished design?
Endless hours of research to find trusted sources (which is harder than you’d expect), then building up a visual map that represents that data before stripping away all embellishments to reveal the essentials. If you don't get the datapoint in a matter of seconds, then it's failed.
What’s been the most challenging scenario or set of information to visualise so far?
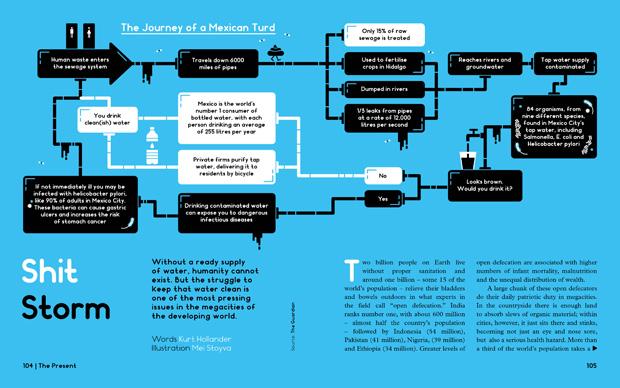
The journey of a Mexican turd from colon to coastline. It might sound trivial, but black water disposal is a huge issue in the developing world, and the problems it causes are sprawling. Getting the flow of the information right took a few tries.
How do you crack the art of great info graphics in an editorial context like Weapons of Reason? - Tell us your top tips…
01 Well curated data – leave out what isn't essential.
02 Purity of visuals – no extraneous elements or decoration to detract from immediate understanding.
03 Make visuals travel fast – include less for the viewer to have to decode before meeting the payoff. Consistent point sizes on fonts and stroke lines help with this.
04 Make sure the visuals pass contrast tests and can be read universally – similar to on-screen UX testing.
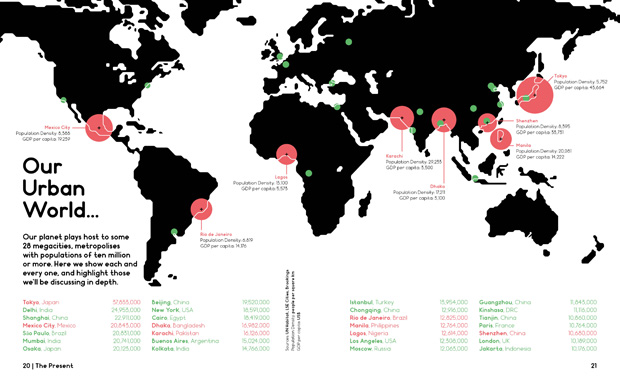
Megamap
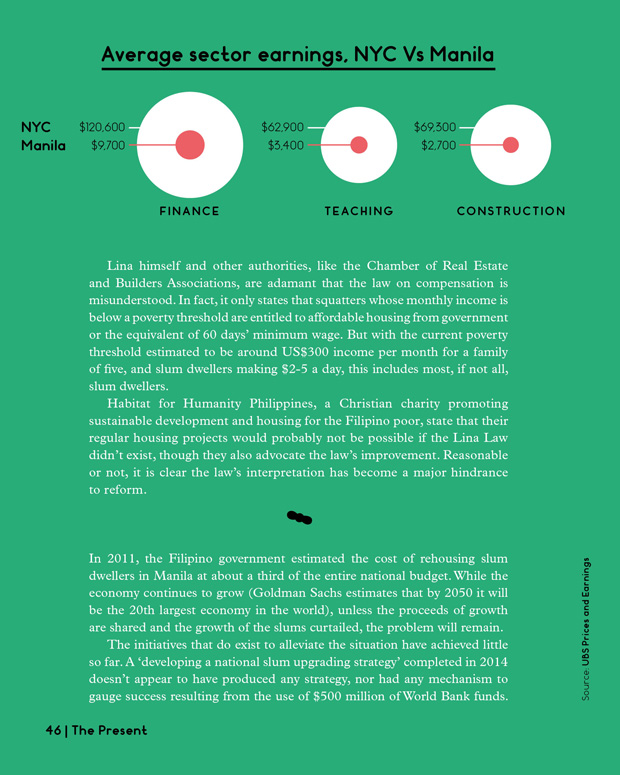
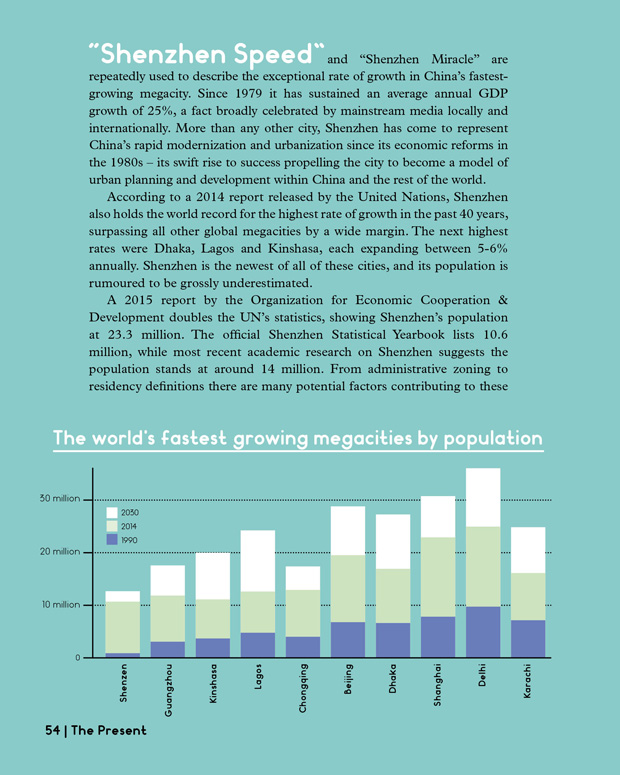
The first two issues of Weapons of Reason have begun with maps to demonstrate the geographical context of the subject we’re exploring and provide a quick introduction to what the reader should expect. In this, the Megacities issue, we’ve looked at the population of each of the world’s megacities, then the population density and GDP per capita (gross domestic product per person) of each megacity we’re featuring in the magazine. You quickly start to get a picture of one of the issue’s key themes: inequality.
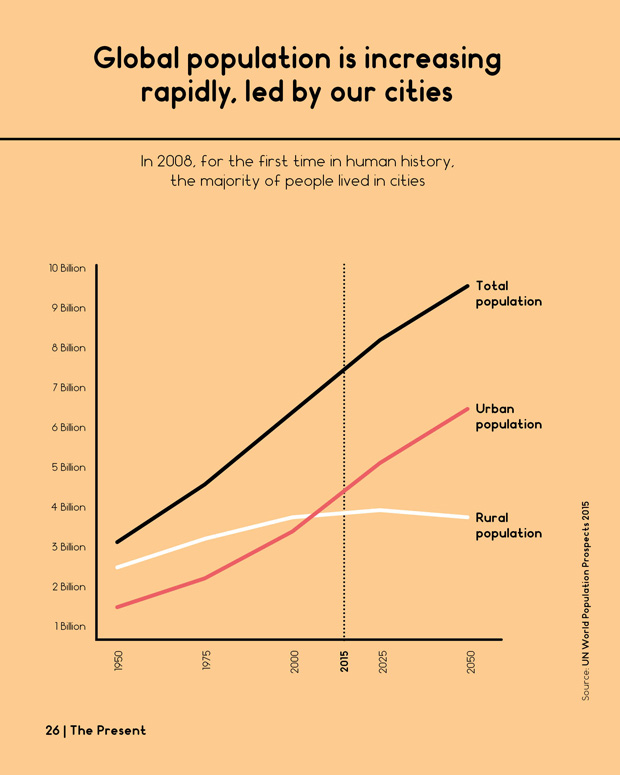
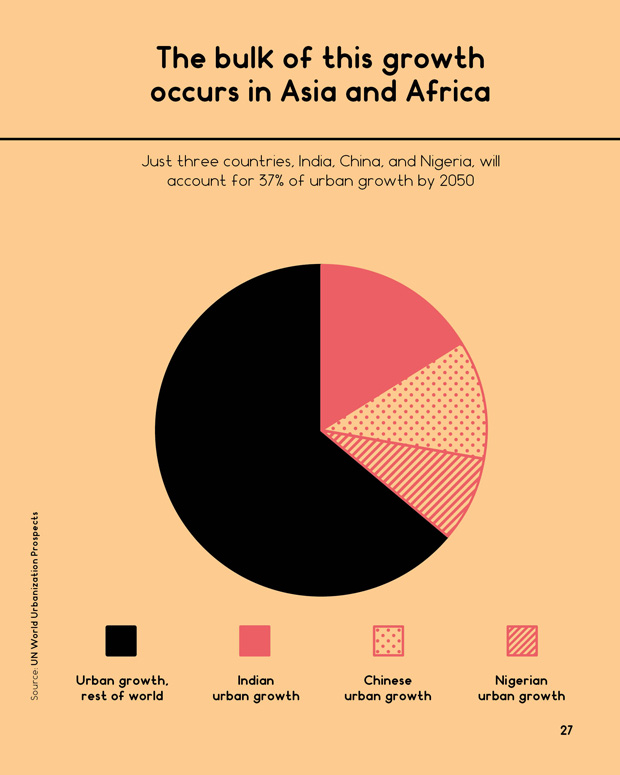
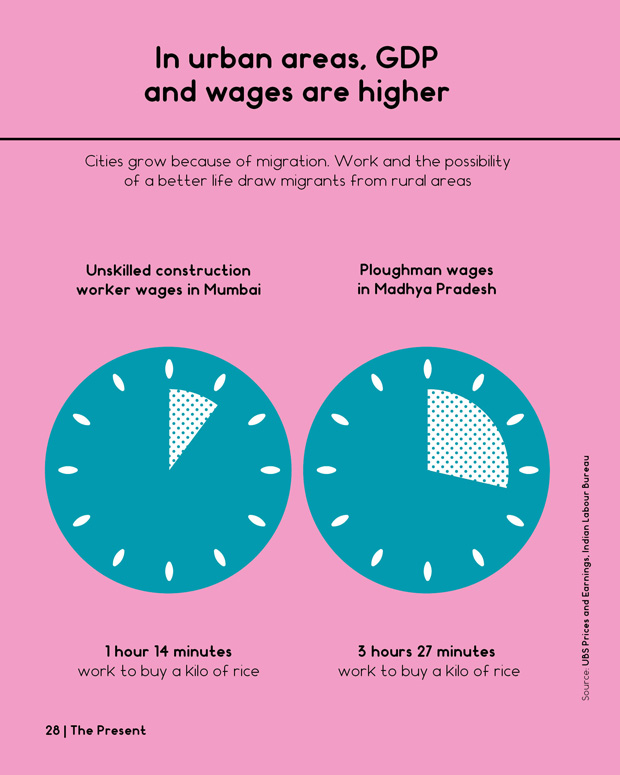
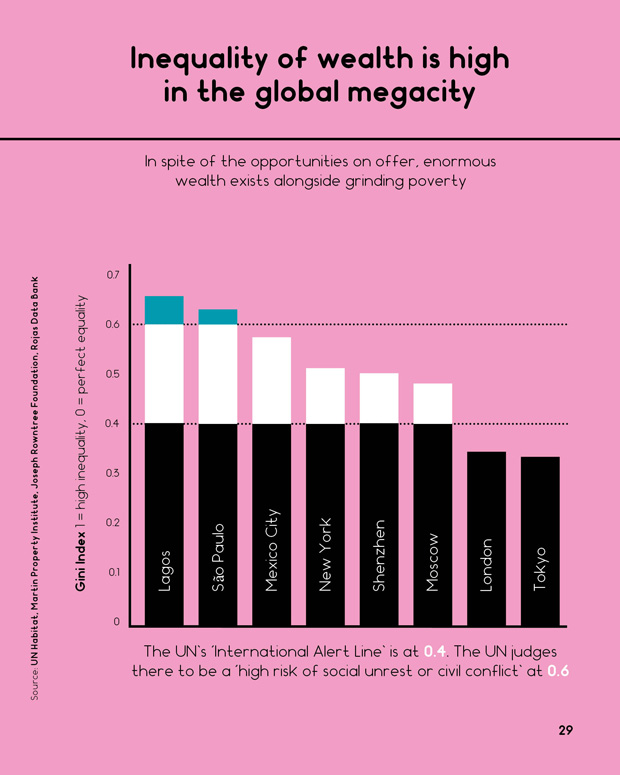
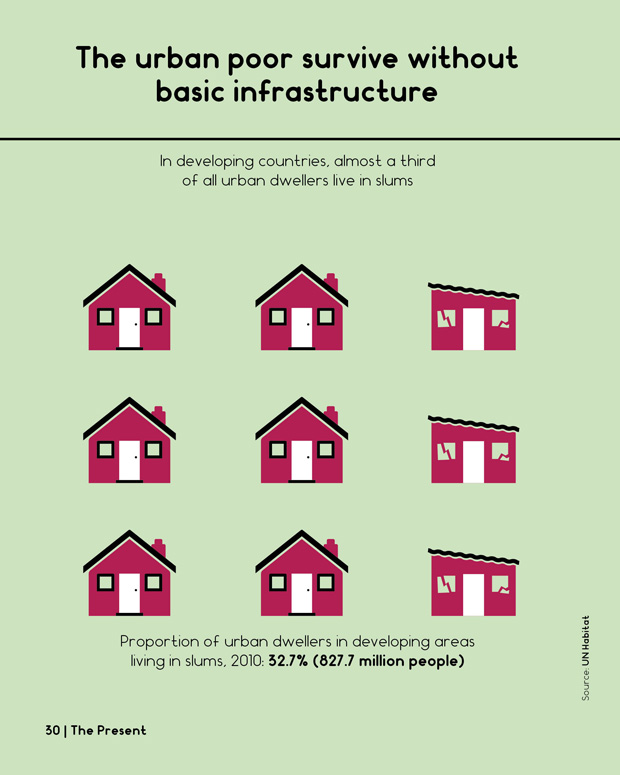
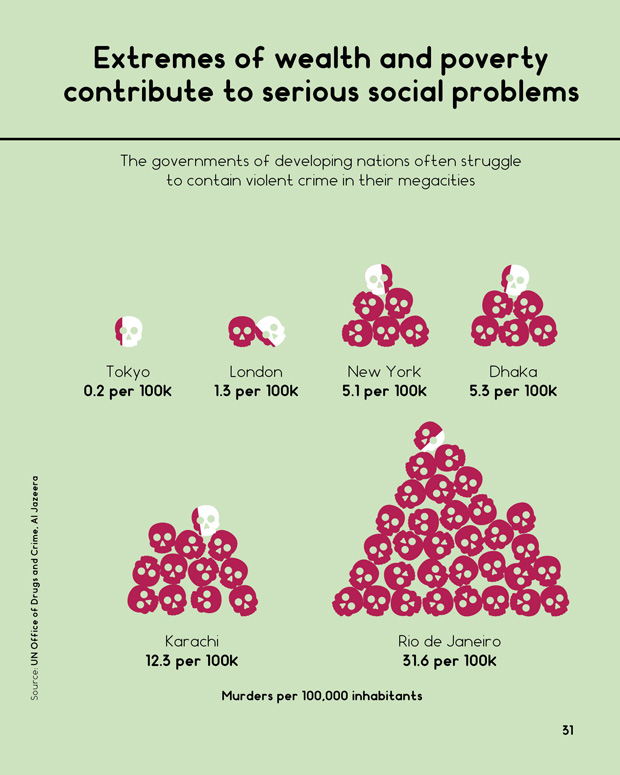
Datapoint
To introduce The Present section of the magazine we put together six pages of stats that we feel summarise the overarching themes of the issue; namely rapid population growth in the global south, the marked differences between urban and rural living and the threat of violence brought about by poor quality of life in megacity slums. It’s a cheerful start!
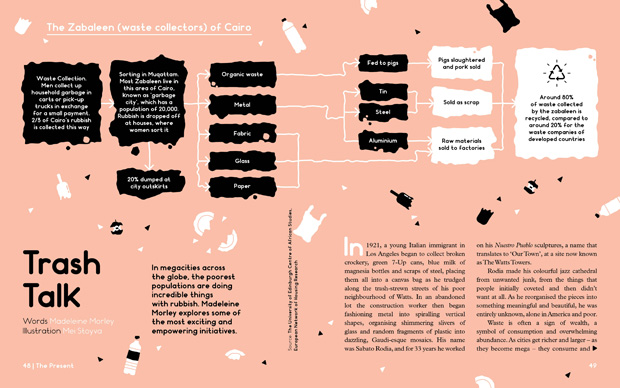
Waste
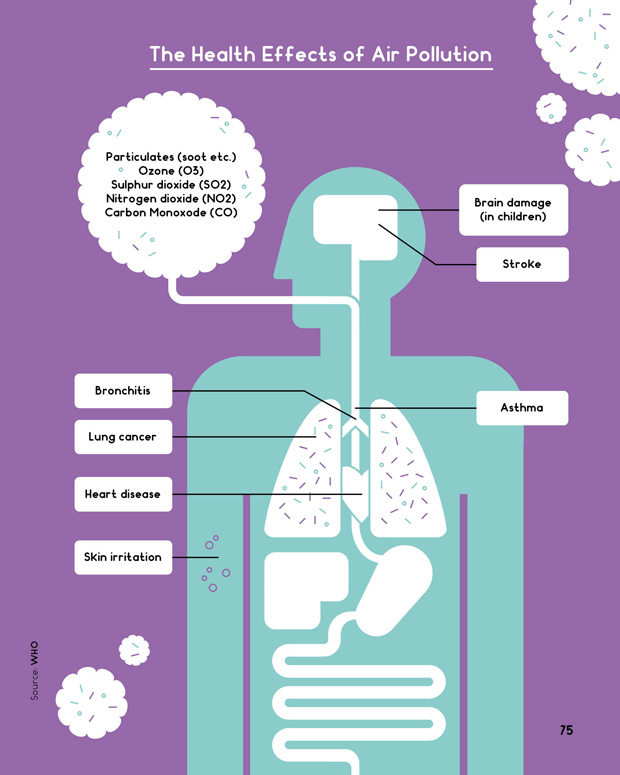
Throughout the Megacities issue there are a few subjects we chose to discuss in general terms instead of focussing in on the problems of a single city. These are waste, air pollution and access to clean water – universal problems in all but the most developed megacities. For these pieces, we wanted to construct simple diagrams that explained the processes behind recycling trash, cleaning (or rather not cleaning) human waste from the water supply, and the negative health effects of inhaling polluted air.
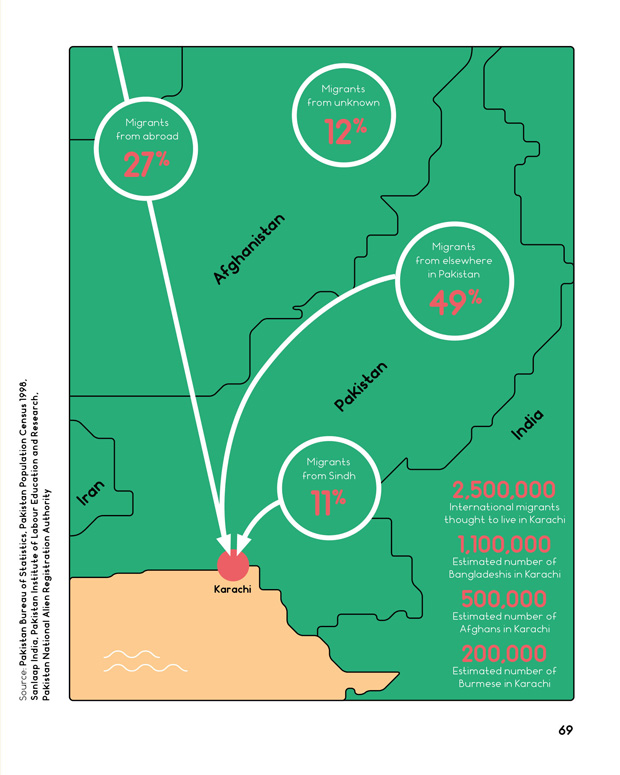
Karachi
Each article in The Present section has it’s own map so the reader can see exactly the region we’re discussing and understand a little better how their problems may have arisen. For example, in the Karachi piece we discuss the effects of population migration on the Sindhi capital. Seeing the city’s proximity to India, Iran and Afghanistan hammers home the potential severity of their fluctuating migrant crisis.
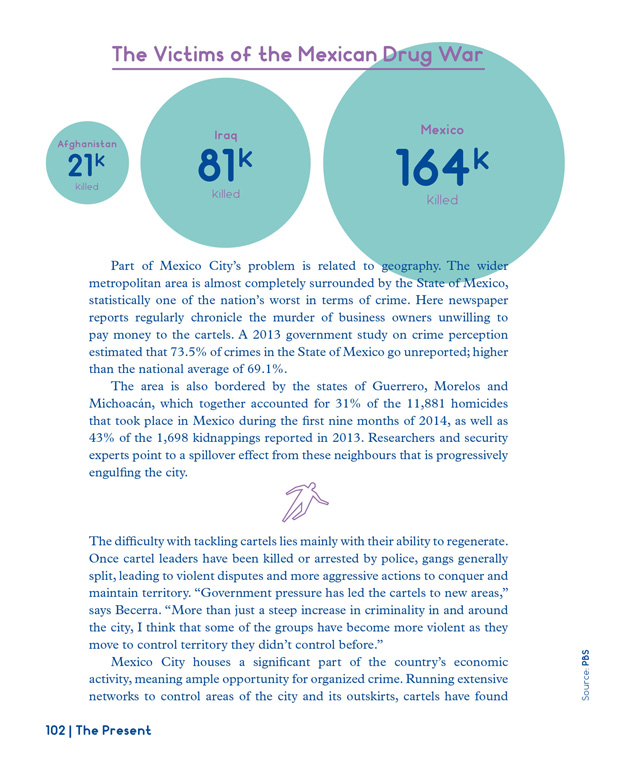
Context
The rest of the data points are really about context, making sure that the numbers we’re presenting can be digested at a human level. When you read that 164,000 Mexicans have been killed as a result of the war on drugs, that seems like a pretty large number. But when you realise that’s more than the death toll of the Iraq and Afghanistan wars combined you get a much more startling picture of the impact it’s having on the nation. It’s pretty horrifying.
Weapons of Reason received two accolades in the inaugural Stack Magazine Awards 2015 — Launch of the Year and Best Use of Illustration.
Visit Weapons of Reason online here.